Do you want a lightning-fast WordPress site that your audience and search engines will love? In this multi-part series, you’ll learn how to analyze and fix various WordPress performance issues. Instead of posting a laundry list of optimizations that may or may not help, I will show you how to measure and identify your performance bottlenecks. This approach will help you focus your time and energy where you will see the biggest benefit.
Not using WordPress? That’s OK. Many of these tools and techniques apply to any website. In this first installment, you will learn how to measure site performance and make a couple of real-world optimizations that take just a few minutes and cost nothing. Let’s get started!
Our WordPress performance goal
The goal: We want to shorten the amount of time it takes for your content to show up in a visitor’s browser after they navigate to your site. To do this, we need to take a few measurements to establish a performance baseline.
A little Google performance jargon
Google has done a lot of work on website performance, so I am going to introduce a couple of the terms they use:
First Contentful Paint (FCP) Google defines FCP as “how long it takes the browser to render the first piece of DOM content after a user navigates to your page.” This is how long it takes for a visitor to see the first bit of content on your page after they type your URL in their browser and press enter or click a link to it on another page. The “first piece of DOM content” could be an image, some text, etc.
Largest Contentful Paint (LCP) Google defines LCP as “when the largest content element in the viewport is rendered to the screen.” Google stops the timer when your page’s largest piece of content (without scrolling down) shows up in the visitor’s browser window. This could be a photo or block of text, for example.
FCP and LCP clearly define when we will read the time on our pretend stopwatch to record our measurements. If we are successful, our FCP and LCP numbers should be lower after we make any optimizations. There is a lot more jargon to be learned on Google’s Lighthouse documentation page, but FCP and LCP are all you need to know for this how-to.
Our performance measuring tools
Google has provided two great tools to measure FCP and LCP, Google Lighthouse and PageSpeed Insights. Lighthouse is a plugin for the Google Chrome browser, and PageSpeed Insights (PSI) is a website where you can enter the URL for the site you want to test. Lighthouse and PageSpeed Insights (PSI) are nearly identical in functionality, and Lighthouse powers PSI under the hood. For this how-to guide, let’s use PSI.
Open PageSpeed Insights in a browser and type in the full URL for your website, including the “https://” part, and click “Analyze.”
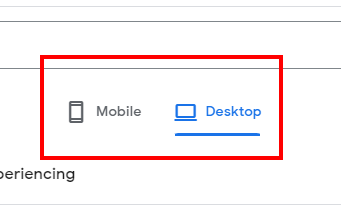
Once the analysis completes, you can select between two sets of results: “Mobile” and “Desktop.” The mobile analysis factors in a smaller screen and limited bandwidth. Let’s examine both results because Statista states that over half of website traffic is now from mobile devices.
Let’s look at the performance results from FireflyWP.com for both mobile and desktop.
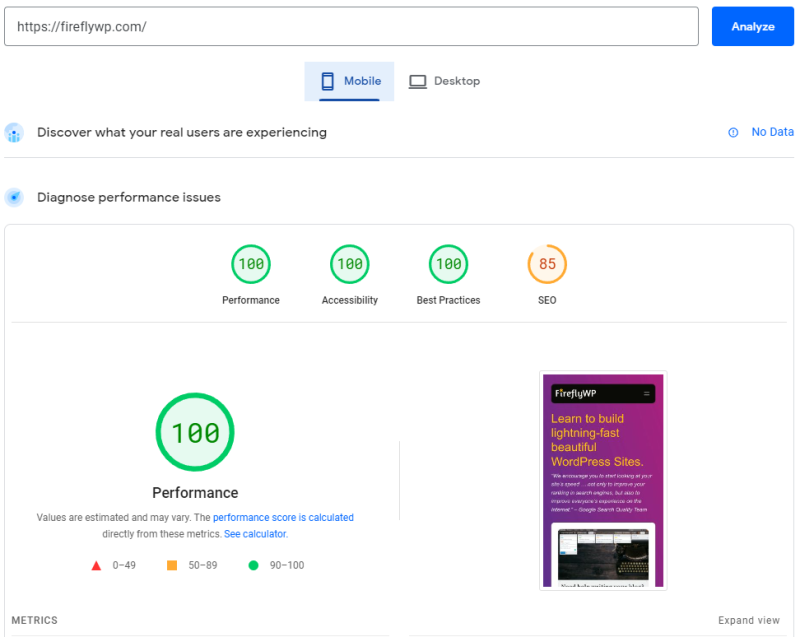
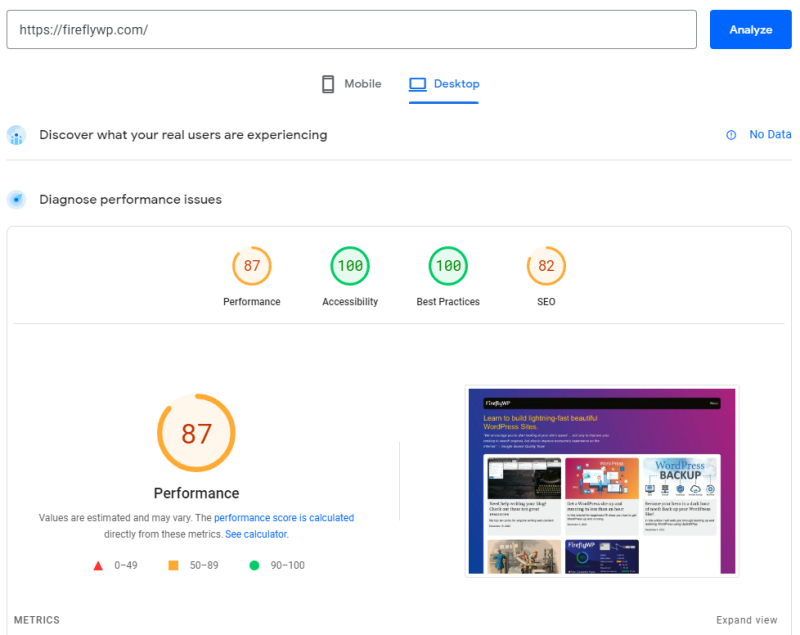
Interestingly, this WordPress site running on a basic, $12 per month DigitalOcean plan has a 100 performance score on the mobile side without any optimizations. This demonstrates that WordPress is already quite fast out of the box. The 87 performance score on the desktop side is a little embarrassing. More on that later. Although unrelated, I want to note that the SEO score is 85 because I have the site set to discourage search engines until it’s ready for the world. Moving on…
Capture your WordPress performance baseline
Scroll down a bit and write down your “First Contentful Paint” (FCP) and “Largest Contentful Paint” numbers for both mobile and desktop. You can also print the pages and save them as PDF docs or take screenshots. Do this two or three times to ensure your numbers are relatively consistent. Save these numbers for later when we want to validate our improvements.
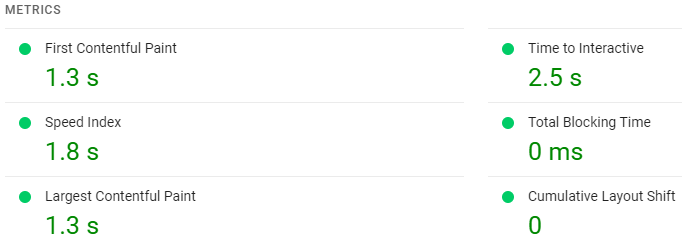
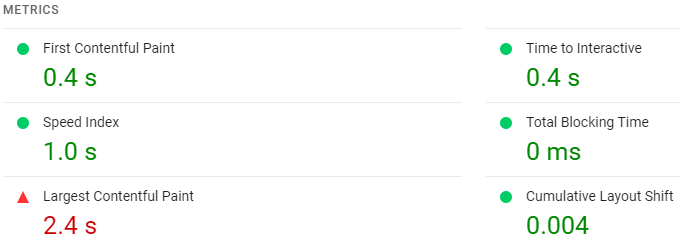
You now have a baseline to measure future improvements. I am looking at my Largest Contentful Paint (LCP) score for desktops and not feeling good about it. This means visitors to the FireflyWP.com home page must wait 2.4 seconds until they see the largest piece of content in their browser. This is a good segway to the next section…
Performance issue #1: big images
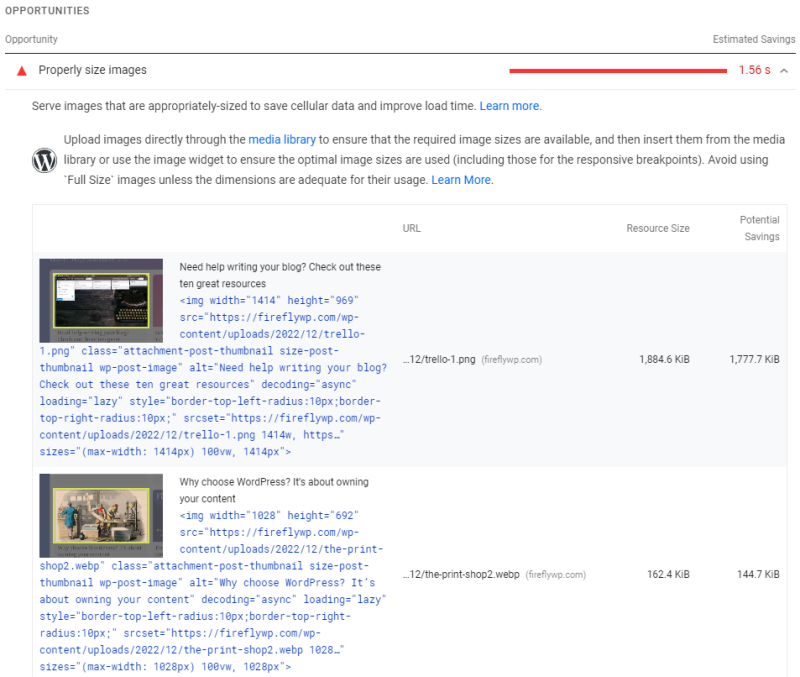
Select the desktop results in PageSpeed Insights (PSI) and scroll down to “Opportunities.” In the screenshot below, notice the WordPress logo and the advice regarding the WordPress media library. PSI can detect if you are using WordPress and suggest WordPress-specific optimizations, which is pretty handy.
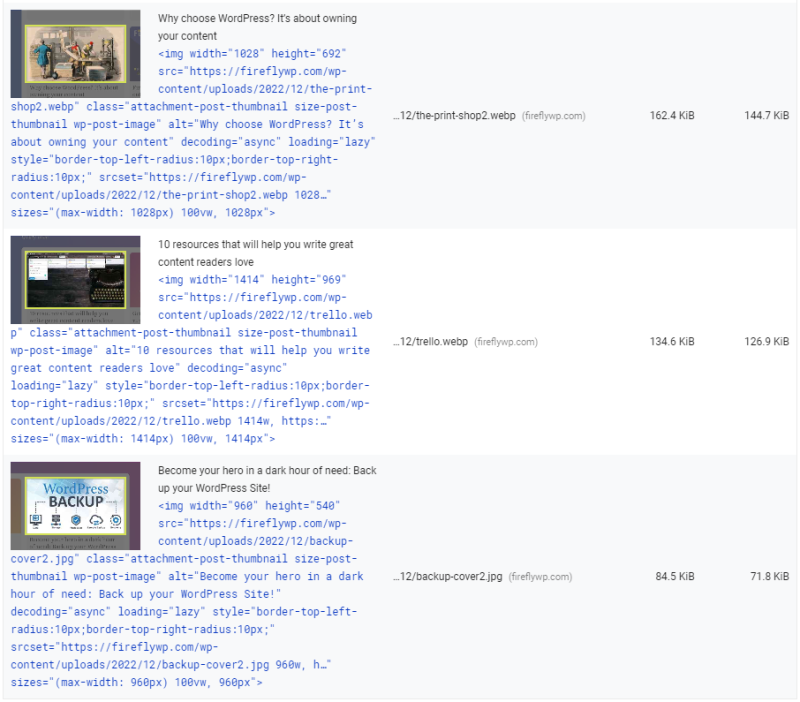
Your results will obviously differ from mine, but let’s run through some opportunities and fixes for FireflyWP.com. The first opportunity is a big one. I uploaded a screenshot as a PNG of 1.8 megabytes for a post-cover image. This is embarrassingly large for a web image, especially one displayed in a box less than 400 pixels wide. The next image is far smaller at 162.4 Kilobytes, but this is still too big for a cover image on the home page.
Use GIMP to fix those big images
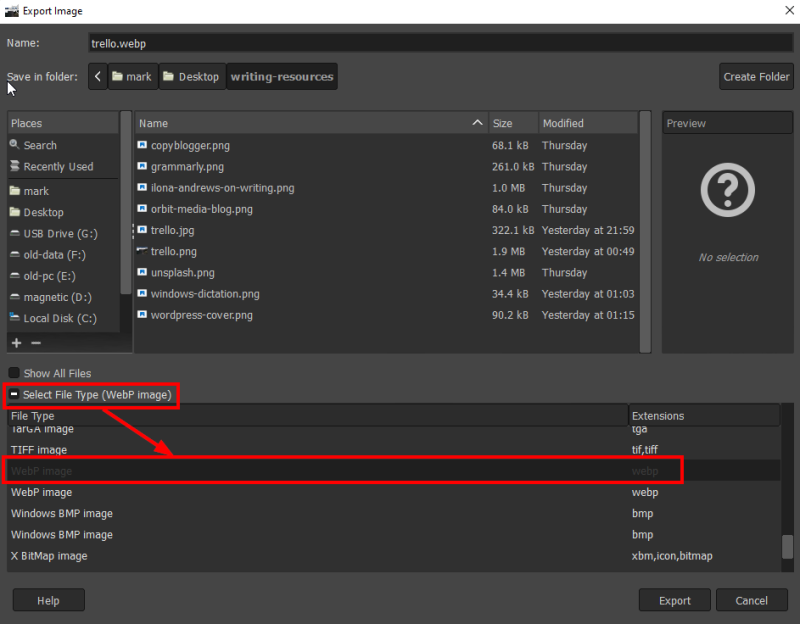
For my first improvement, I will convert that 1.8Mb PNG image to a “WebP” format to reduce the file size. WebP is an image format like JPEG developed by Google to provide better image compression than JPEG for websites. I’m using GIMP to make the conversion because it’s free and supports exporting to WebP out of the box.
Let’s compare the results of the image conversion. The old PNG version was a little over 1.8 Megabytes. The new WebP version that looks identical to my eye is only 134K. That’s less than 8% of the original file size!
I deleted the old PNG version of the image from the WordPress media library to ensure I didn’t accidentally use it again and uploaded the new WebP version. Let’s rerun PageSpeed Insights again and see what we get with the desktop analysis.
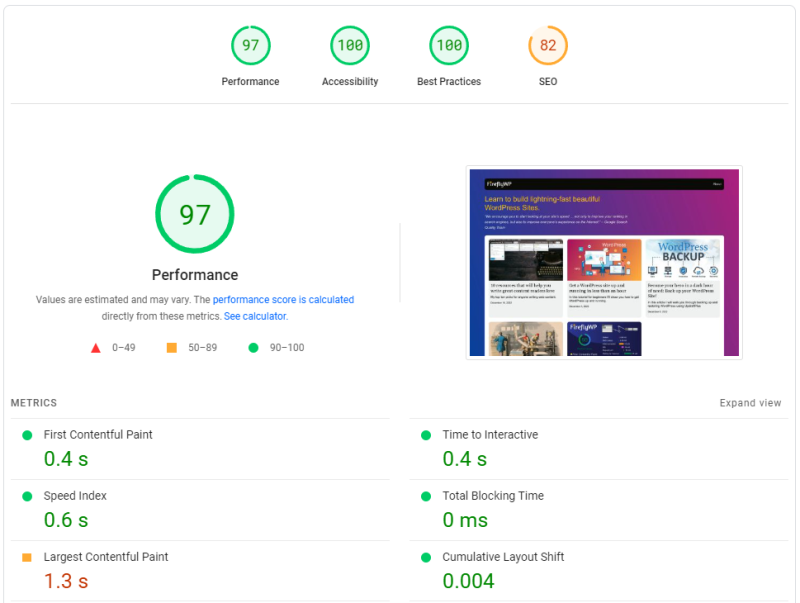
With this one optimization, the performance score went from 87 to 97, and the LCP dropped by over a second. This is a pretty good improvement for five minutes of effort! Let’s see what else we can optimize.
Performance issue #2: Wrong image for the job
I scrolled down to the “Opportunity” section again and found that WordPress served high-resolution images for the home page cover images. This is not what I expected.
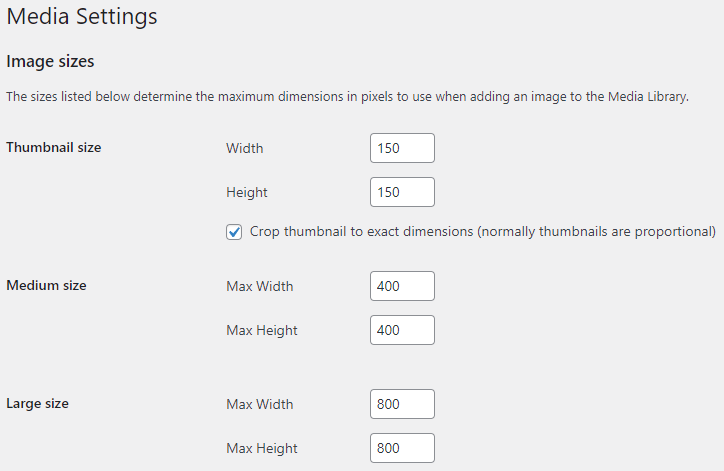
The cover images on the FireflyWP home page are supposed to be less than 400 pixels wide. When configuring my WordPress instance, I set my medium-size images to a max width of 400 pixels. When you upload files to WordPress via the media library, it will resize them into thumbnails, medium-size, and large-size images.
I expected that because the images on the FireflyWP home page were less than 400 pixels wide, WordPress would serve up the 400 pixels, medium-sized images.
Let’s go for a perfect 💯performance score!
I am using the new Twenty Twenty-Three WordPress theme, so I opened up the site editor to see what I could do.
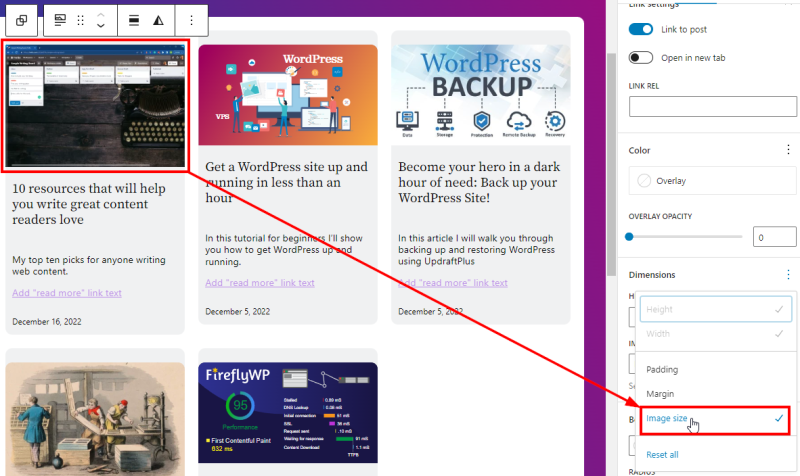
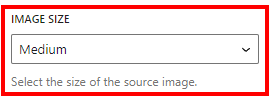
If you select one of the featured images in the home page query loop, you can activate the image size attribute (see above). Now you can tell WordPress to use the medium image size. If you are still getting familiar with the full-site editor, don’t worry, I will cover this in another post.
At first, my browser continued to load up the high-resolution image despite clearing the cache and doing a full reload. After waiting a bit, I tried again, and sure enough, the browser pulled the medium size images. Yay! WordPress uses a “srcset” property to provide the browser with the minimum resolution image it needs to do the job, depending on the screen size. Unfortunately, understanding why the browser picks a particular resolution from the available images can be tricky.
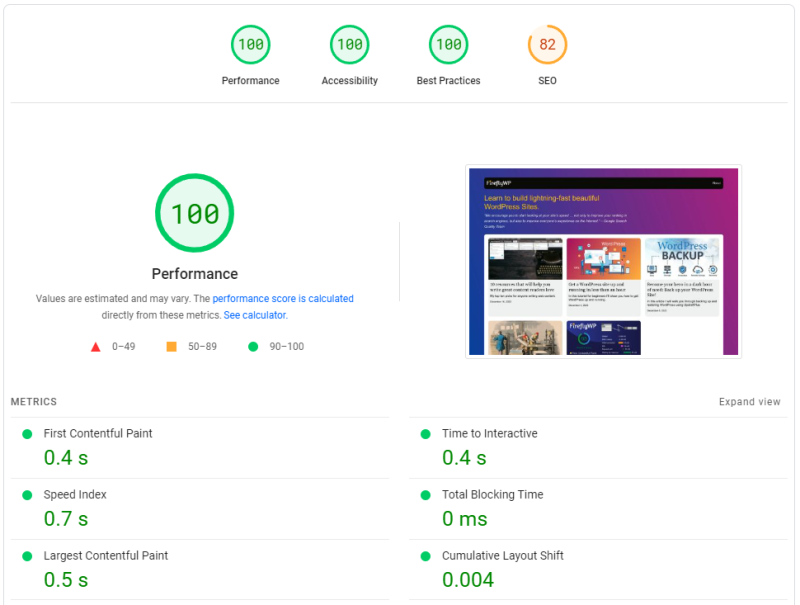
Now it’s time for the moment of truth. Did our image optimizations get us to a perfect performance score?!?
Yes! Yes, it did! Our Largest Contentful Paint (LCP) on the desktop results is down to half a second from our original desktop LCP of 2.4 seconds. These two optimizations improved the site load time by 480%!
Further enhancements
I could go on and continue making incremental improvements, but the process I follow is the same: Measure, optimize and repeat. After a few optimizations, you will hit a point of diminishing returns where the time and expense outweigh the benefits. Here are some front-end optimizations I might try on FireflyWP.com:
- Implement a Content Delivery Network (CDN). A CDN will cache and serve your images from a data center closer to your user. This is a good idea if you have a lot of international users to reduce latency.
- Reduce the number of resources being loaded by the site. Some caching/performance plugins will allow you to combine JavaScript and/or CSS, so your browser spends less time loading separate resources.
Preview of Part 2
All the optimizations I discussed in this first part have been on the “front end” (the browser). You may find that your biggest performance bottleneck is how quickly your WordPress instance renders and serves HTML. We’ll cover this and part 2. I’m interested to hear what performance issues you find on your site. Post in the comments below. Thanks!
Leave a Reply